In this mapping process identifying and geo-coding high flood levels on the ground. Identify the maximum water levels observed at various parts of the village during 2018 floods. Correcting existing digital elevation models using field level data collected as part of the survey. Models were used to map the flood depth across the panchayath for the 2018 floods. The map was verified with community volunteers and finalized the map.
Activities Undertaken Prior to the Project
Phase 1: Established Benchmarks in Various Locations & Cross Verification
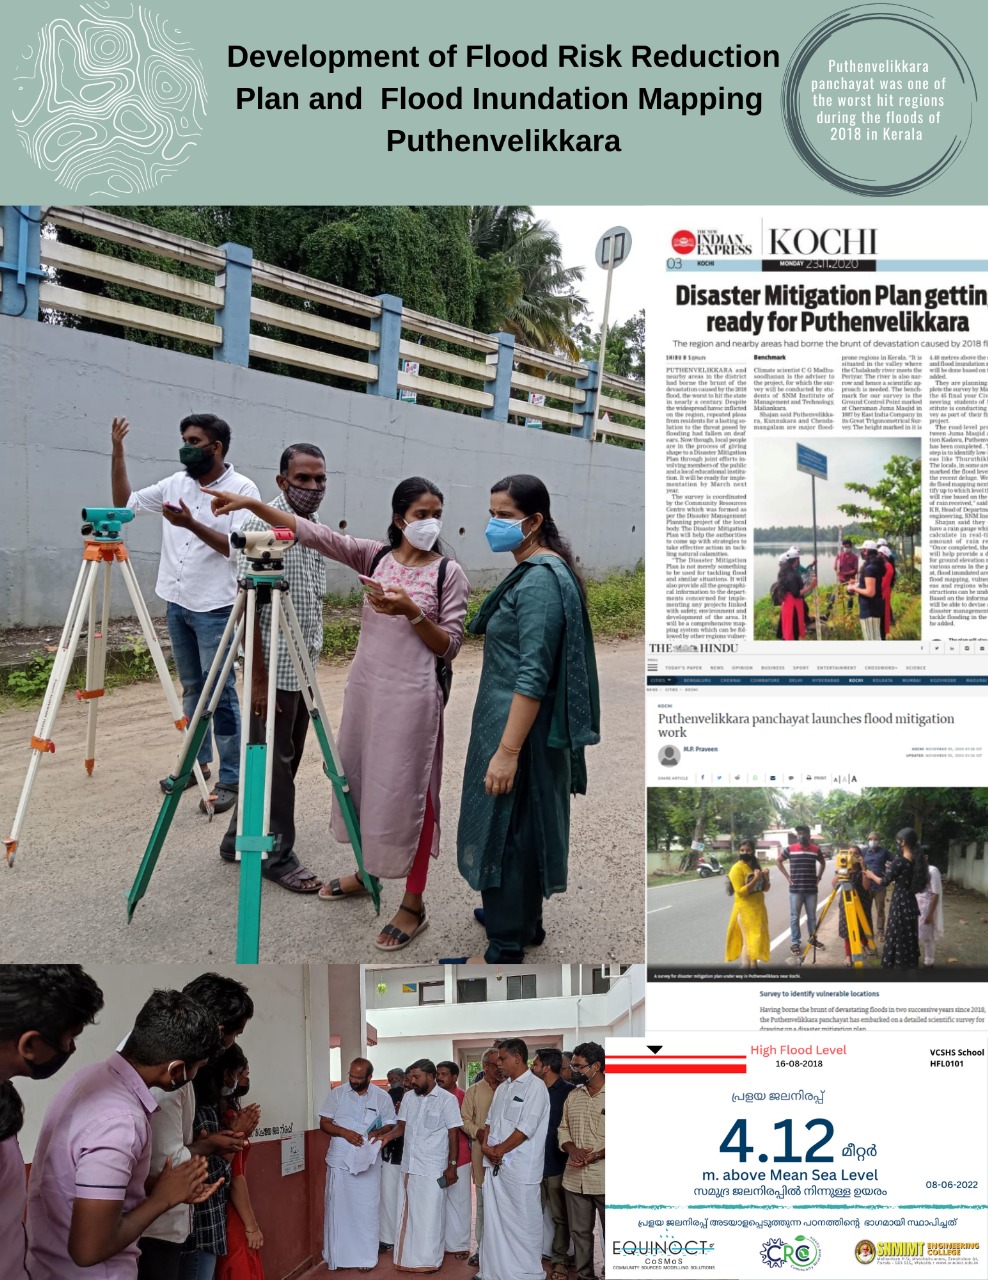
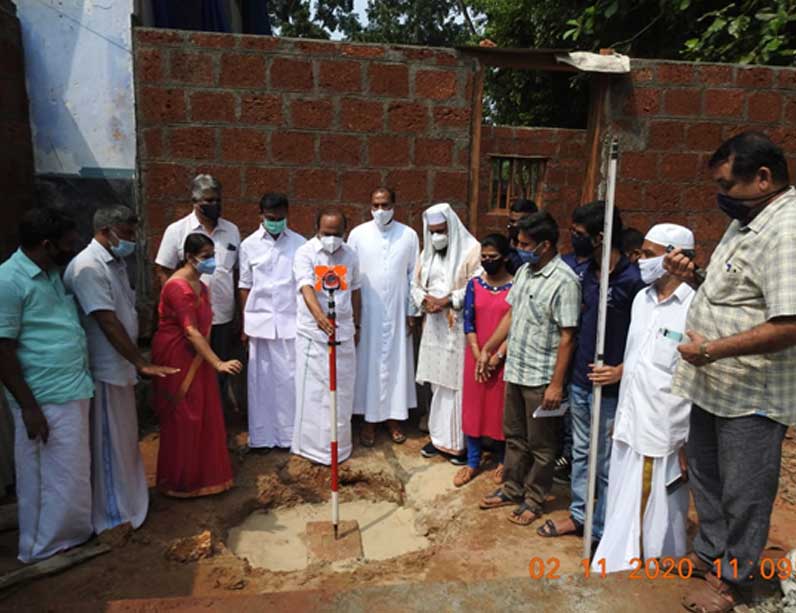
The first phase of the work was conducted during 2020–2022 with the help of local volunteers and students from Sree Narayana Mangalam Institute of Management and Technology (SNMIMT), Paravur. The programme was inaugurated by Adv. V. D. Satheesan MLA at Cheraman Juma Masjid, Kodungallur on November 2, 2020.
A Great Trigonometric Survey (GTS) permanent benchmark established in 1887 by British surveyors was used as the reference point for the Puthenvelikkara Flood Inundation Map. The survey was completed in one month, followed by assessment and establishment of temporary benchmarks along the survey path.
The Highest Flood Level (HFL) observed during the 2018 flood at VCSHSS School, Station Kadavu, Puthenvelikkara was commemorated with a plaque unveiled on June 8, 2022 (World Ocean Day), by Sri Ullas Thomas, President of Ernakulam District Panchayat and co-chairperson of the District Disaster Management Authority.
The GTS benchmark was a stone located at Cheraman Masjid, Kodungallur, 4.4 meters above mean sea level. Accurate elevation data is critical for flood inundation mapping as many existing models (like Google Maps) contain significant errors. After reaching Puthenvelikkara, benchmark elevations were marked at key village sites — bridges, public buildings, schools, churches, and temples.
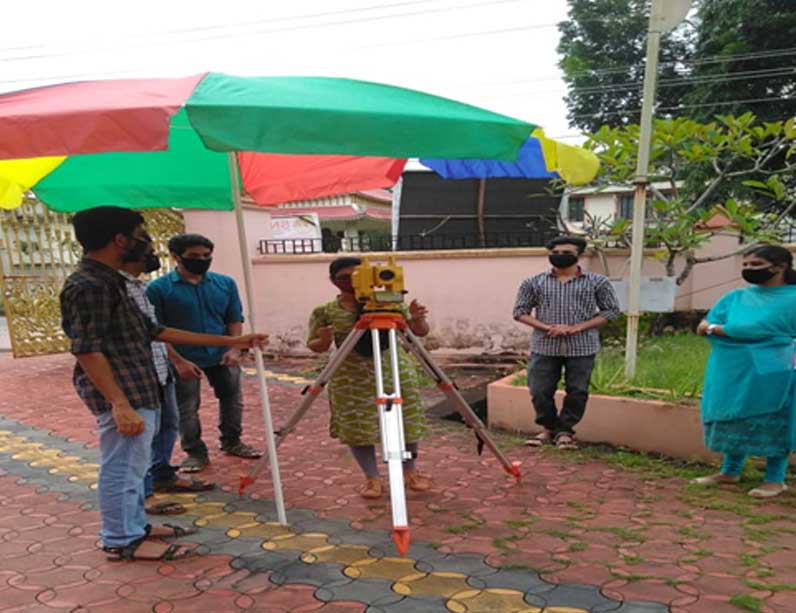
The 8 km survey — from the benchmark to various village sites — was conducted using Total Stations and Auto Levels. Previously recorded flood levels were verified on-site to improve map accuracy. At two vulnerable points (VCSHSS and Station Kadavu bridge), plaques were installed to mark accurate 2018 flood levels.
These plaques serve as permanent reminders of one of the most devastating floods in recent memory and lay the foundation for building climate resilience. While the GTS benchmark was revived more than a century later, these new markers may soon become vital reference points amid accelerating climate change.
Phase 2: Flood Inundation Mapping
The main objectives of Phase 2 were:
- Establishing benchmarks for flood inundation mapping
- Carrying out flood inundation mapping
The work began by identifying local volunteers — especially students from schools and colleges. Tools and forms were prepared to gather ground-level data. A training session was organized by the District Disaster Management Authority and led by Smt. Usha Bindhumol (Deputy Collector & CEO, DDMA Ernakulam) at VCSHSS Puthenvelikkara.
Surveys were carried out in May 2023 by volunteers led by CRC Puthenvelikkara. They identified maximum water levels recorded across the village during the 2018 flood event.
Phase 3: Mapping the Boundaries of High Flood Levels
EQUINOCT completed this phase by correcting existing digital elevation models (DEMs) using field data. These refined models helped map flood depths across the panchayat for the 2018 flood. The maximum flood depth — about 5 meters — was observed in local wetlands. Community volunteers participated in verifying the final flood map.
Conclusion and Way Forward
The flood inundation mapping for Puthenvelikkara brought together stakeholders from local government bodies, the District Disaster Management Authority, District Collectorate, schools, colleges, elected representatives, religious institutions, farmers, fishers, volunteers, clubs, women’s self-help groups, and affected residents.
This initiative successfully combined scientific methods with local knowledge and community engagement. It stands as a scalable model for decentralized climate action — strengthening hyper-local climate resilience and empowering communities through co-created solutions.